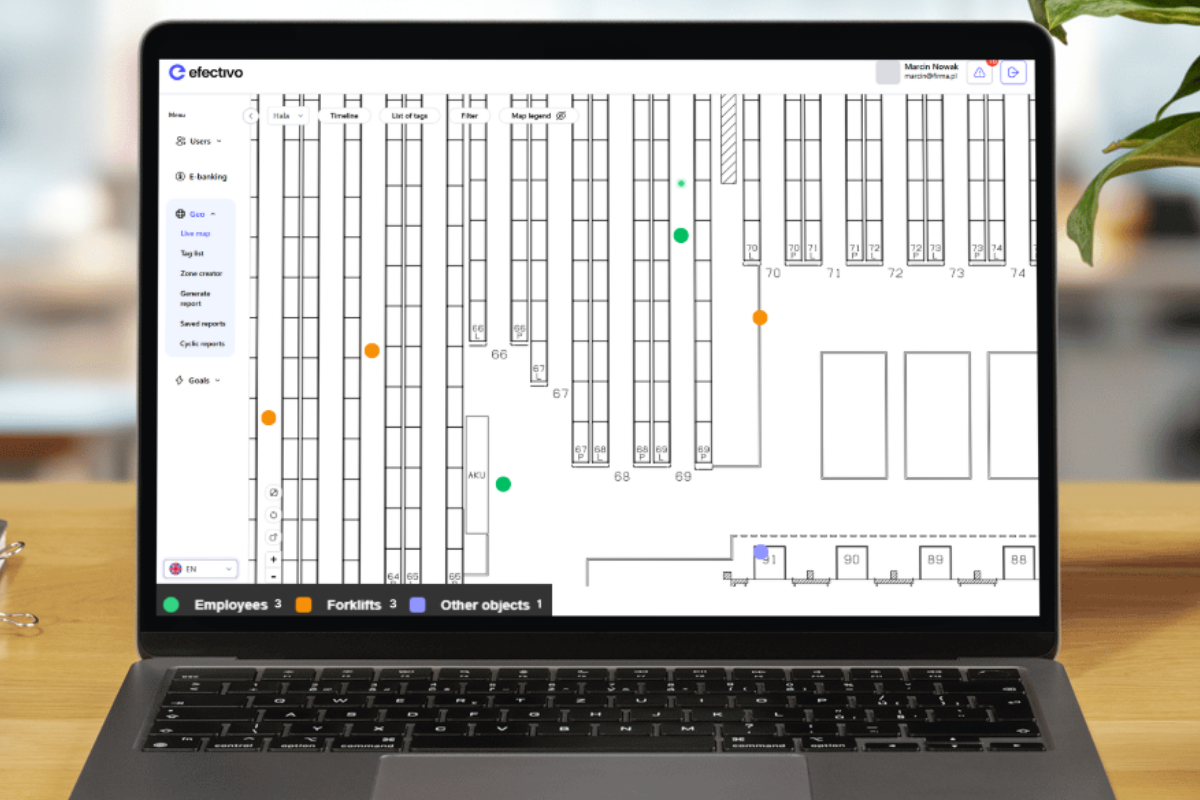
In a warehouse environment, it is crucial to track the location of assets and analyze the movement of employees, forklifts, and other assets. Thanks to the Heatmap report in the efectivo system, you gain a tool that intuitively presents the intensity of various activities in the monitored area, making it easier for you to make the right optimization decisions.
How does the Heatmap report work in efectivo?
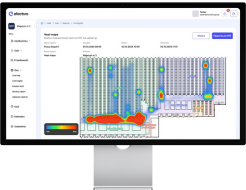
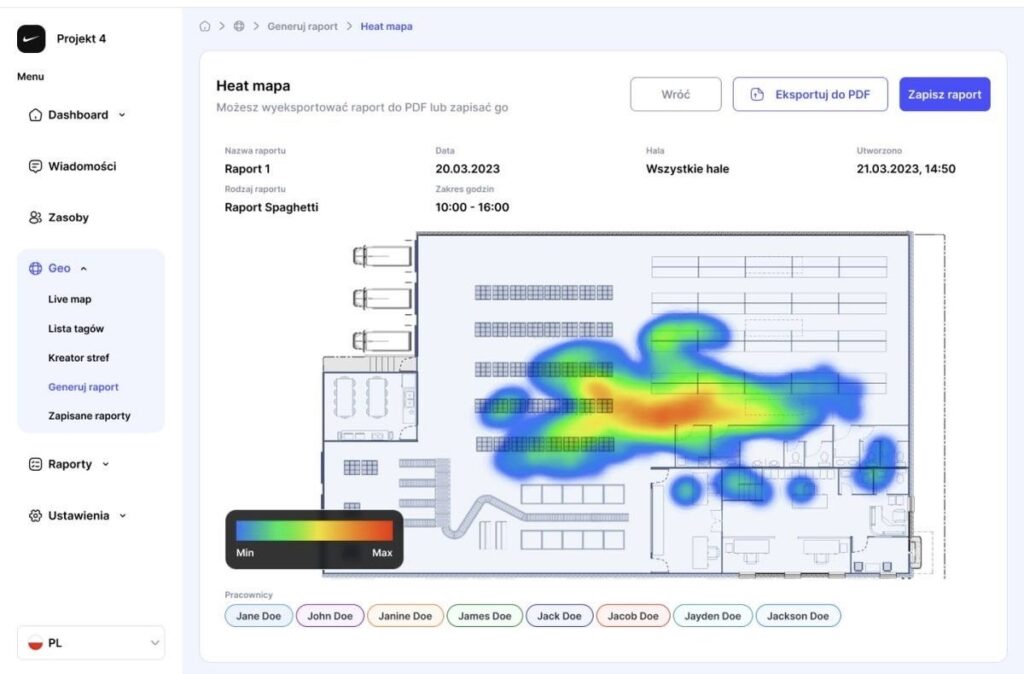
A heat map is a technique that allows for a graphical presentation of information on the behavior of resources in a given space, such as a warehouse. This is a visualization that shows which areas are most visited by employees, vehicles, and equipment using a color gradient (from blue to green and yellow to red):
- Red – indicates places with the highest traffic, where the most activity is concentrated;
- Green/yellow – indicates areas with a medium frequency of use, of moderate interest;
- Blue – shows the areas visited the least, which may be an unused potential of the warehouse.
The Heatmap report in the efectivo system provides key information about the movement of RTLS tags, revealing both places where they move in a limited range and areas with their excessive concentration. Such data often indicates the existence of logistical bottlenecks, unplanned downtime, or inefficient use of space. With this analysis, problem areas such as traffic jams at loading bays, overcrowding in picking aisles, or unused storage areas can be quickly identified, and optimization measures can be taken.
4 Key Benefits Of Heatmapa In Stock
1. Identify bottlenecks and increase warehouse throughput
In every warehouse, there are places where the traffic of employees and forklifts thickens, creating so-called bottlenecks. These are usually narrow aisles, transport path crossings, or areas around popular racks, where queues often form. Such bottlenecks significantly increase lead times, increase the risk of collisions, and reduce overall operational efficiency.
The Heatmap report in the efectivo system visualizes the traffic volume across the entire warehouse area, clearly indicating the areas with the highest concentration of activity (red zones). Thanks to this analysis, specific optimization actions can be taken:
- Traffic reorganization – the introduction of one-way paths for forklifts or the designation of separate routes for pedestrians eliminates chaos and reduces travel time.
- Redistribution of goods – moving frequently picked assortment from overloaded areas to less frequented areas of the warehouse balances the load and shortens picking routes.
- Changing the layout of racks – widening narrow aisles or changing their configuration allows to increase in the flow of traffic.
Practical example: Optimisation in a pharmaceutical warehouse
In one of the pharmaceutical warehouses, Heatmap's analysis revealed that as much as 60% of trolley traffic was concentrated around one rack with the most popular drugs. Employees wasted time waiting in queues, and narrow aisles around the rack caused additional delays. After the analysis, solutions such as dispersion of the assortment were implemented – the most frequently picked products were located in three different warehouse locations. In addition, priority zones have been designated, i.e., separate paths have been designated for trolleys delivering goods to the picking zone. As a result, the order picking time was significantly shortened, and the number of collisions in the rack area decreased. With the heatmap, warehouse management was able to make decisions based on hard data rather than guesswork. By identifying unused zones (blue areas on the map), the space that has been used for additional storage spaces has been put to better use. The effectiveness of traffic forecasting has also improved – the analysis of historical data from Heatmap allows you to predict peak periods and better plan tasks.
2. Minimise the risk of collisions and increase safety in the warehouse
In warehouses where workers share space with forklifts and other machinery, collision points pose a serious safety risk. High-traffic crossroads are potential outbreaks that can lead to worker injuries, damaged goods and downtime. Heatmap identifies these hazardous areas by analyzing data from RTLS tags and shows places with the highest traffic where workers and machines meet most often, areas with medium activity levels that require attention, and safe areas with minimal traffic.
With Heatmap, warehouse safety management switches from a reactive to a proactive mode, allowing you to prevent accidents before they even happen. It is an investment that brings measurable benefits both in human and economic terms. Precise visualization of traffic volumes enables effective countermeasures, such as:
- Designation of dedicated, separate paths for pedestrians and wheelchairs
- Introduction of one-way traffic at critical points
- Marking danger zones with clear signs and floor markings
- Real-time notifications for truck operators when approaching a risk zone
- Speed limit in sensitive areas
- Change work schedules to spread traffic over time
- Assignment of traffic coordinators during peak periods
- Training employees in the new traffic rules
Successful implementation example - food warehouse
In one of the large distribution centers of the food industry, the analysis of Heatmap revealed a particularly dangerous point – the intersection of the main transport aisle with the path leading to the packaging area. An average of 5 dangerous situations per day were recorded in this place. Thanks to this analysis, solutions were implemented that eliminated the risks. Among other things, separate, secured paths for pedestrian workers have been marked. Alerts have also been implemented in the efectivo system to signal dangerous situations. The management also decided to move the packing station by 15 meters to separate the traffic flows. It also created more effective evacuation procedures.
As a result of the measures taken, the time to get through the risk zone was shortened by approx. 50% and the occurrence of dangerous incidents was reduced, improving the overall sense of security among employees. In addition, the number of minor damages to goods decreased by approx. 30%.
3. Warehouse layout optimisation – strategic space planning for maximum efficiency
In traditionally organized warehouses, improper placement of goods leads to a number of operational problems. Long and inefficient picking paths are not only a waste of time, but also increase fuel/energy costs for forklifts, faster wear and tear of equipment, operator fatigue, extended lead times, and reduced efficiency of the entire team.
The efectivo system, by analyzing data from Heatmap reports, provides key information for designing an intelligent warehouse layout:
- Analysis of order co-occurrence
- Identify products that are frequently ordered together
- Detection of natural commodity groups
- Mapping links between inventory categories
- Visualize flows
- Track the most common picking routes
- Identification of "dead zones" in the warehouse
- Traffic density analysis at different times of the day
- Simulation of changes
- Testing different scenarios for the placement of goods
- Calculate potential time savings
- Forecasting the effects before implementing changes
Example of transformation - industrial warehouse
In a 15,000 m² spare parts warehouse, Heatmap's analysis revealed:
- 45% of the picking routes led through the same three aisles
- The average travel distance was 142 meters per request
- 20% of the warehouse space was used marginally
As a result of the implemented changes, as part of which the zones were reorganized, routes were optimized, and infrastructure changes were introduced, excellent results were achieved, i.e.:
- 30% reduction in average travel distance
- 20% increase in the number of orders processed per shift
- 18% savings on truck operating costs
By combining historical and predictive analysis, the warehouse can not only respond to current challenges but also actively shape its future performance. It is a transition from static storage to dynamic space management, where every square meter works for the company's profit.
4. Planning investments and expansion of the warehouse
Uneven use of space generates unnecessary maintenance costs and reduces operational efficiency. The Heatmap report in efectivo provides key data for making strategic investment decisions:
- Precisely indicates areas that need to be expanded (red zones)
- Identifies unused spaces (blue areas)
- Allows simulation of various expansion scenarios
In the case of designing new warehouses, the data from Heatmapa enables the implementation of proven solutions proven in the existing operations, conscious avoidance of errors in the functional layout that have been identified in the current infrastructure, and optimal planning of efficient transport routes already at the design stage.
Heatmap analysis finds specific applications in warehouse space management. In existing facilities, it allows for intelligent use of the available space – by:
- Add racks at critical points
- Taking advantage of dead zones
- Modernization of key communication routes
Praktyczny przykład, firma logistyczna
A company used Heatmap data to design a new distribution center. Heatmapa transformed the warehouse planning process from intuitive to data-driven decisions, ensuring optimal use of every square meter of warehouse space. Thanks to the changes introduced, the following have been achieved:
- 25% better space utilization
- 30% shorter picking routes
- 35% increase in productivity
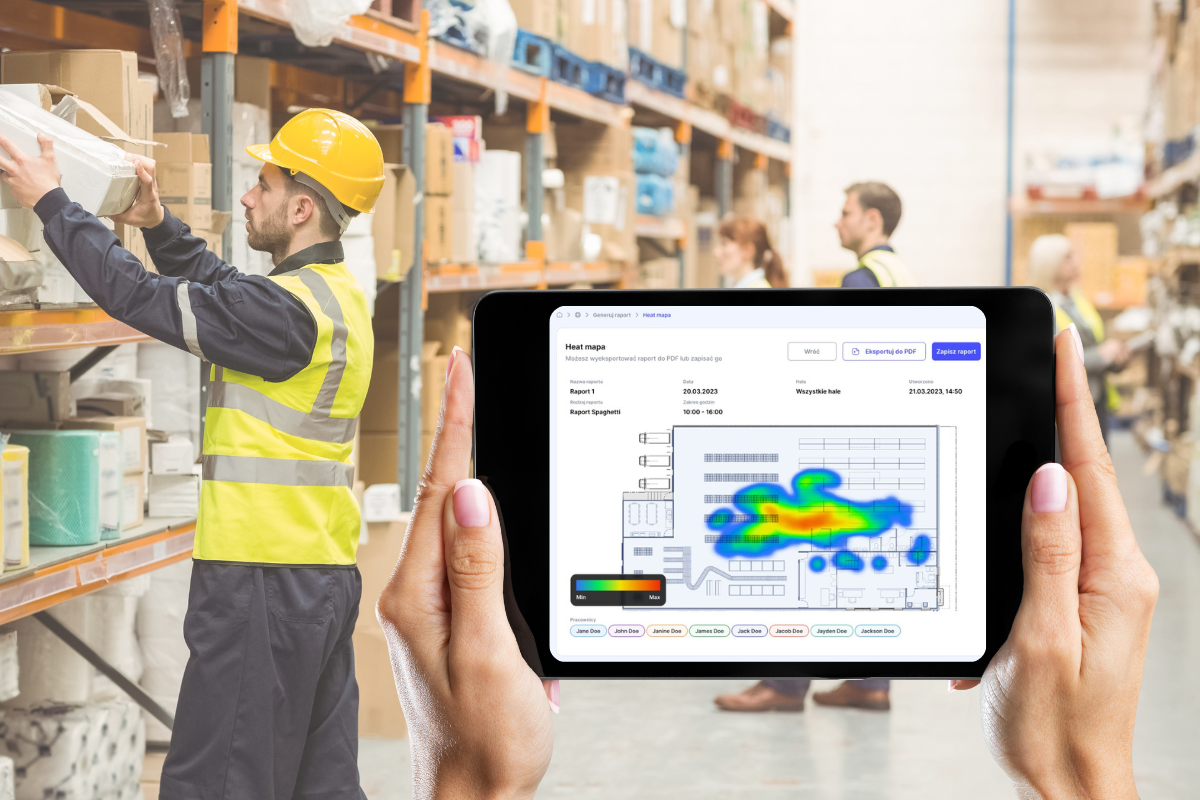
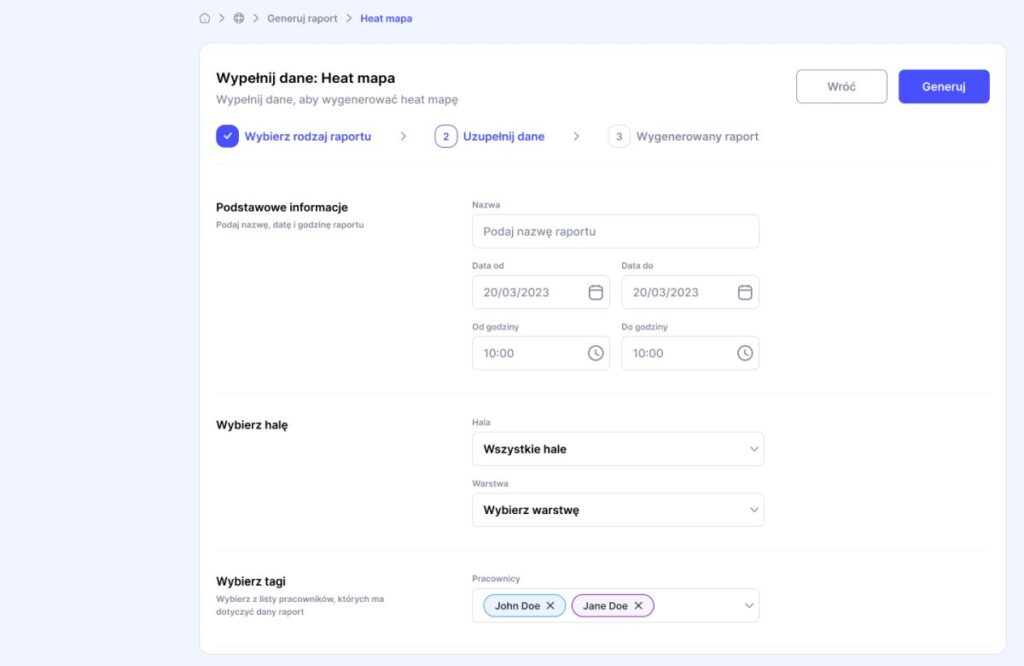
Konfiguracja raportu, jak wygenerować dane?
In the efectivo system, you can customize the Heatmap report to your needs, choosing from intuitive configuration options. The process of generating the data is simple and is done by selecting the appropriate parameters in a clear user interface.
You can define the scope of your analysis by specifying:
- Title of the report – e.g. "Analysis of movement in the picking zone – June 2024".
- Date range – from-to (day and month).
- Hours – e.g. 08:00-16:00 (full work shift) or only peak hours.
- Hall – selection of a specific storage area.
- Layer – analysis of the selected zone (e.g. high storage racks, loading area).
- Tags – filtering data by specific employees, carts or groups of resources.
With these options, the report is personalized and provides the accurate information needed to optimize processes.
Summary:
Heatmap analysis in efectivo brings comprehensive benefits to warehouse management, offering both immediate improvements and long-term strategic benefits. This solution allows you to achieve measurable savings by eliminating bottlenecks and shortening the time of order turnaround, while increasing work safety by identifying and eliminating danger zones. However, the greatest value of Heatmapa is its role as a tool supporting strategic decisions – every investment in the development of the warehouse can now be made based on objective data and precise analyses.
Heatmapa allows you to take preventive action, preventing problems before they even occur, providing up-to-date data for daily operations management, and enabling long-term planning for the development of warehouse infrastructure. With this technology, the warehouse is transformed into a well-oiled machine, where every element – from the racking layout to the transport paths – works in perfect harmony, creating a working environment with maximum efficiency.
Want to see how Heatmap can optimize your warehouse? Contact us and schedule a demo of the efectivo system!
Read also Monitor Your Warehouse In Real Time With The Live Map In The Efectivo System!