In the world of intralogistics, where every move and every second counts, process optimization is the key to success. At efectivo, we understand this perfectly. That is why our efectivo system for real-time asset localization (RTLS) is equipped with an extensive analytical module. It includes ready-made reports that will help you increase your warehouse's efficiency. One of them is the Spaghetti diagram.
The report's name perfectly captures its essence - the visual representation of the paths of movement of employees and other resources in the warehouse resembles this beloved dish all over the world. If you think you know your warehouse inside out, the Spaghetti chart might surprise you!

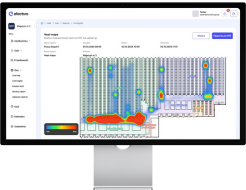
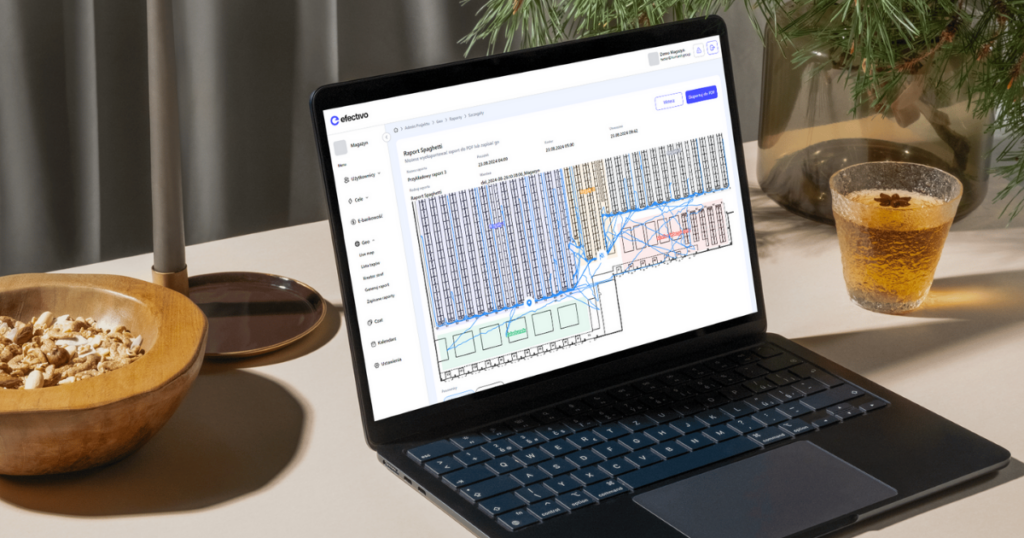
Spaghetti Diagram – mapping the efficiency in your warehouse
The Spaghetti chart accurately maps the route taken by assets such as employees or forklifts over a specific period. As a result, it reveals areas of inefficiency that may be difficult to identify at first glance.
This analytical tool provides concrete data to make informed optimization decisions, as well as to ensure greater safety in warehouses. The Spaghetti diagram in efectivo allows, for m.in, to analyze the presence and movement of an asset in a given area over a specific time. On this basis, you can easily determine how much time a given employee spends in a particular zone of the warehouse and whether this time is adequate for the tasks performed. You will also identify time lost to unnecessary activities, deviating from the norm or employee profile. By comparing changes in the paths of resource movement, you will assess the effectiveness of the optimizations introduced. This is only a fraction of the possibilities offered by access to the data contained in the report.
From data to concrete improvements - the benefits for your business.
The Spaghetti diagram gives you a complete overview of the movement of assets in a specific area and over time so you can easily trace what exactly happened in the warehouse or on the production floor. Here are some examples of real benefits for your business:
- Having accurate data about the whereabouts of your asset every second: Thanks to the location of resources with an accuracy of up to 30 cm you will gain full visibility and control over what is happening in your warehouse.
- Identify downtimes, misplacements, and bottlenecks: Identify bottlenecks in your process and areas for optimization.
- Reduce activities that do not add value to the process, e.g., minimize empty trips: You will improve your workflow and save time and resources.
- Asset location history on the company map: Track the movement path of a specific asset and analyze its interactions with other assets. In this way, you will gain knowledge about damage to vehicles, racks, and the situations that led to it.
- Reduce forklift operating costs: Analyze forklift usage, optimize forklift routes, reduce the number of forklifts, and reduce operating costs.
- Precise control of working time: By monitoring the working hours of individual employees, you will settle them fairly and improve operational efficiency.
- Optimize transport routes: Plan the shortest and most efficient routes to save time and fuel.
- Increased safety: You will analyse the routes of employees and forklifts to prevent accidents, especially in danger zones.
- Better space management: You will optimize the placement of goods and increase the efficiency of the use of available space, improving loading and unloading.
Examples of the use of the Spaghetti diagram in warehouse management.
Sounds good, but what does it look like in practice? How do we interpret these complicated lines and turn them into specific conclusions and improvements? Here are some examples of how a warehouse manager can use the Spaghetti diagram available in efectivo to improve the efficiency of work in the warehouse.
- Optimizing the picking path: In the chart, you have noticed that order pickers travel too long distances. In addition, the Spaghetti chart shows which paths are the most popular and where bottlenecks occur. Based on this, you can optimize the placement of goods to reduce picking time and unnecessary movements.
- Identifying the causes of delays: Are there frequent delays in order processing? Use the Spaghetti chart to trace the movement of assets related to a given order. It may turn out that the delays are due to improper placement of the scanner, lack of a forklift in a given place, or congestion.
- Assessing the effectiveness of the new space organization: Have you made changes to the warehouse layout? The Spaghetti diagram will allow you to assess whether the new solution brings the expected results. Compare before and after shifts to see if workers are traveling shorter distances, if material flow is smoother, and if congestion has been reduced.
- Monitor forklift performance: The Spaghetti chart will show you where the longest waiting times occur and whether the forklift driver is choosing the optimal route. On this basis, you can optimize the planning of forklift trucks and reduce operating costs.
- Verification of compliance with traffic zone procedures: Do employees follow designated routes and safety procedures? The Spaghetti diagram will allow you to verify whether employees are not shortening the route through traffic-free zones, driving forklifts into pedestrian zones, or putting pallets in the designated place.
- Identify unused space: Resource path analysis can reveal areas of storage that are rarely visited or overlooked entirely. This may indicate the untapped potential of the storage space.
- Record collisions, impacts or accidents:With the Spaghetti diagram, you will get information about the assets that have been involved in a collision or accident. You will be able to track the event, assign the resource to the right person, and easily determine the exact time of the event.
Precise data, tailored to your needs
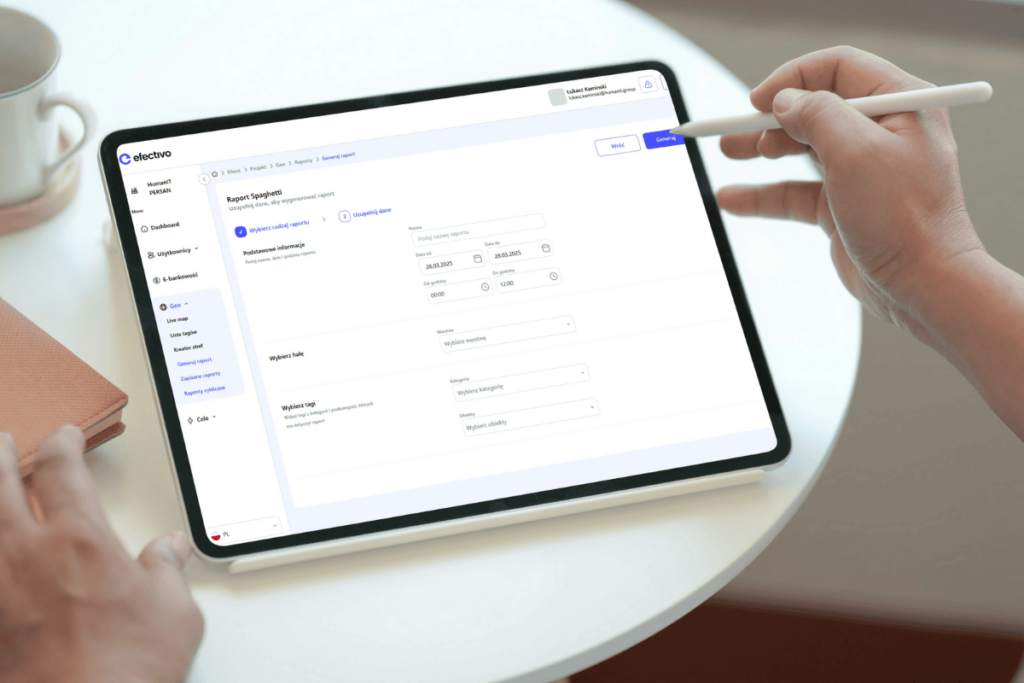
The Spaghetti diagram offers advanced filters that allow you to customize the report to your needs and analyze specific aspects of your warehouse's operation. By using appropriate filters, we will receive data in the form that interests us.
- Date range: Specify a specific month or day in a from-to perspective to analyze the situation during a given period.
- Hours: Focus on specific working hours to identify problems at specific times in the day.
- Hall: Select a specific area of the warehouse to analyze the workflow.
- Layer: Select a warehouse layer (zone) to visualize the work in that zone.
- Tags: Select specific employees or assets to trace their movement paths. You can also select predefined groups of employees to analyze the work of the entire team.
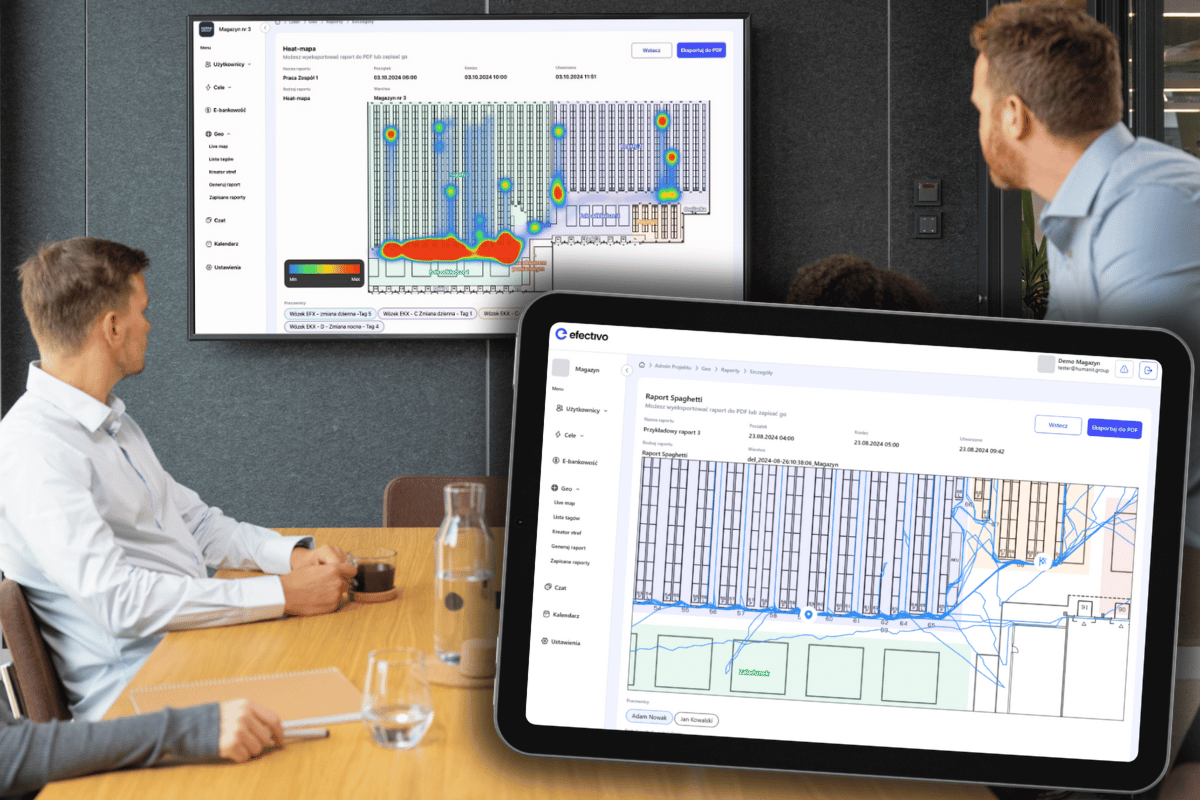
How it works – the highest precision of the RTLS system.
The key to the effectiveness of the Spaghetti diagram in efectivo is the precise RTLS system, which monitors the location of resources in a given area with an accuracy of 30 cm. A Spaghetti chart is a mapping of the path of a tag (employee or other resource) over a specific period. The report is created based on the location of the tags read by the anchors. Each point on the graph is the exact position of the tag at a given moment, which allows for a faithful representation of the route and identification of even the smallest irregularities. Thanks to this, you can be sure that the data you rely on is reliable and credible.
Your warehouse and production hall under control.
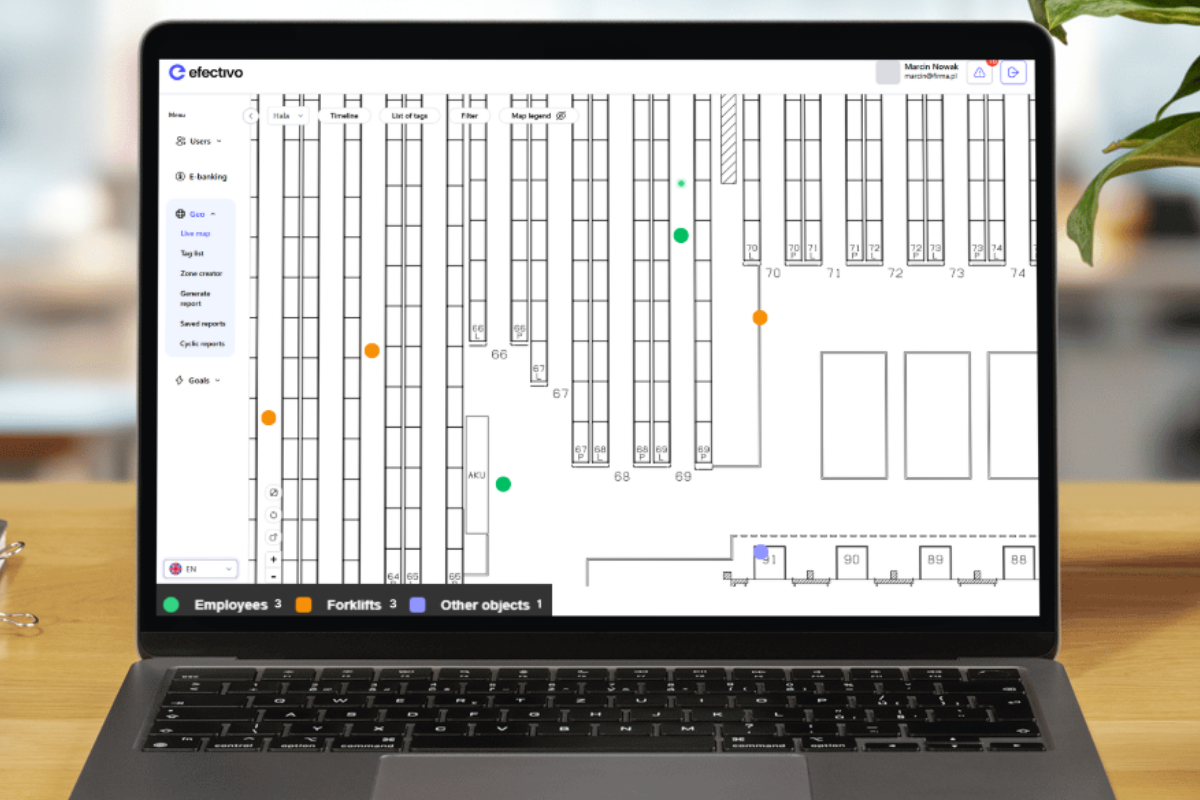
The Spaghetti diagram in efectivo is just one of the many tools we offer to help companies optimize the operation of their warehouses and production. Our RTLS software provides comprehensive data on every aspect of operations – from the location of resources in real time (live map), through the duration of individual operations, to the analysis of the occupancy of individual zones and much more. This comprehensive information allows you to make informed decisions based on facts, not intuition, and have a real impact on business efficiency.